性能分析之go pprof工具使用
1. go pprof工具简介
在 Go 语言中,PProf 是用于可视化和分析性能分析数据的工具,PProf 以 profile.proto 读取分析样本的集合,并生成报告以可视化并帮助分析数据(支持文本和图形报告)。
- runtime/pprof:采集程序(非 Server)的指定区块的运行数据进行分析。
- net/http/pprof:基于 HTTP Server 运行,并且可以采集运行时数据进行分析。
1.1. 分析内容
- cpu(CPU Profiling):
$HOST/debug/pprof/profile,默认进行 30s 的 CPU Profiling,得到一个分析用的 profile 文件 - block(Block Profiling):
$HOST/debug/pprof/block,查看导致阻塞同步的堆栈跟踪 - goroutine:
$HOST/debug/pprof/goroutine,查看当前所有运行的 goroutines 堆栈跟踪 - heap(Memory Profiling):
$HOST/debug/pprof/heap,查看活动对象的内存分配情况 - mutex(Mutex Profiling):
$HOST/debug/pprof/mutex,查看导致互斥锁的竞争持有者的堆栈跟踪 - threadcreate:
$HOST/debug/pprof/threadcreate,查看创建新OS线程的堆栈跟踪
1.2. 分析方式
-
go tool pprof命令交互方式
-
web网页方式查看
http://ip:port/debug/pprof/
2. 代码配置pprof
2.1. Gin框架集成pprof
调用github.com/gin-contrib/pprof,执行pprof.Register(*gin.Engine)。
示例代码:
import (
    "github.com/gin-contrib/pprof"
    "github.com/gin-gonic/gin"
)

type server struct {
    conf *config.Config
    gin  *gin.Engine
}

func (s *server) setupServer() *gin.Engine {
    // 注册pprof
    pprof.Register(s.gin)

    // register routers
    s.setupRoutes()
    return s.gin
}
2.2. 非Gin框架集成pprof
import (
    "net/http"
    "net/http/pprof"

    "github.com/gorilla/mux"
)

// Install adds the Profiling webservice to the given mux.
func Install(c *mux.Router) {
    c.HandleFunc("/debug/pprof/profile", pprof.Profile)
    c.HandleFunc("/debug/pprof/symbol", pprof.Symbol)
    c.HandleFunc("/debug/pprof/trace", pprof.Trace)
    c.HandleFunc("/debug/pprof", redirectTo("/debug/pprof/"))
    c.PathPrefix("/debug/pprof/").HandlerFunc(pprof.Index)
}

func RegisterPprof(){
     //    NewRouter
    muxHandler := mux.NewRouter()
    // register handler for pprof
    Install(muxHandler)
}
3. go tool pprof
3.1. 内存
go tool pprof http://ip:port/debug/pprof/heap
示例:
# go tool pprof http://ip:port/debug/pprof/heap
Fetching profile over HTTP from http://ip:port/debug/pprof/heap
Saved profile in /root/pprof/pprof.yurt-tunnel-server.alloc_objects.alloc_space.inuse_objects.inuse_space.001.pb.gz
File: yurt-tunnel-server
Type: inuse_space
Time: May 10, 2023 at 11:03am (+08)
Entering interactive mode (type "help" for commands, "o" for options)
(pprof) top
Showing nodes accounting for 46.08GB, 94.72% of 48.65GB total
Dropped 319 nodes (cum <= 0.24GB)
Showing top 10 nodes out of 31
      flat  flat%   sum%        cum   cum%
   25.91GB 53.27% 53.27%    25.91GB 53.27%  bufio.NewWriterSize (inline)
   12.91GB 26.54% 79.80%    12.91GB 26.54%  bufio.NewReaderSize
    1.67GB  3.43% 83.23%     1.74GB  3.59%  net/textproto.(*Reader).ReadMIMEHeader
    1.26GB  2.59% 85.83%     1.26GB  2.59%  runtime.malg
    1.22GB  2.51% 88.34%     5.72GB 11.75%  net/http.(*conn).readRequest
    0.86GB  1.77% 90.11%     3.39GB  6.96%  net/http.readRequest
    0.68GB  1.39% 91.50%    13.72GB 28.20%  sigs.k8s.io/apiserver-network-proxy/pkg/server.(*Tunnel).ServeHTTP
    0.58GB  1.20% 92.70%     0.86GB  1.78%  context.propagateCancel
    0.51GB  1.06% 93.76%     0.51GB  1.06%  net/http.(*Server).newConn
    0.47GB  0.96% 94.72%     1.33GB  2.74%  context.WithCancel
3.2. CPU
go tool pprof http://ip:port/debug/pprof/profile
示例:
# go tool pprof http://ip:port/debug/pprof/profile
Fetching profile over HTTP from http://ip:port/debug/pprof/profile

Saved profile in /root/pprof/pprof.yurt-tunnel-server.samples.cpu.001.pb.gz
File: yurt-tunnel-server
Type: cpu
Time: May 10, 2023 at 10:58am (+08)
Duration: 30.14s, Total samples = 35.72s (118.52%)
Entering interactive mode (type "help" for commands, "o" for options)
(pprof) top
Showing nodes accounting for 25120ms, 70.32% of 35720ms total
Dropped 240 nodes (cum <= 178.60ms)
Showing top 10 nodes out of 58
      flat  flat%   sum%        cum   cum%
   12100ms 33.87% 33.87%    12120ms 33.93%  runtime.(*lfstack).pop (inline)
    3360ms  9.41% 43.28%     3360ms  9.41%  runtime.(*lfstack).push
    2200ms  6.16% 49.44%     2200ms  6.16%  runtime.pageIndexOf (inline)
    1350ms  3.78% 53.22%     1520ms  4.26%  runtime.findObject
    1350ms  3.78% 57.00%     3490ms  9.77%  runtime.scanobject
    1120ms  3.14% 60.13%     3550ms  9.94%  runtime.sweepone
    1000ms  2.80% 62.93%    10850ms 30.38%  runtime.scanblock
     910ms  2.55% 65.48%     1310ms  3.67%  runtime.step
     890ms  2.49% 67.97%      890ms  2.49%  runtime.markBits.isMarked (inline)
     840ms  2.35% 70.32%    20300ms 56.83%  runtime.gentraceback
4. 生成火焰图
安装graphviz,用于生成火焰图。
 # ubuntu
 apt-get install -y graphviz

 # centos
 yum install -y graphviz

 # mac
 brew install graphviz
当执行go pprof的命令时,会自动生成.pb.gz文件,例如:
# 内存
Saved profile in /root/pprof/pprof.yurt-tunnel-server.alloc_objects.alloc_space.inuse_objects.inuse_space.001.pb.gz

# CPU
Saved profile in /root/pprof/pprof.yurt-tunnel-server.samples.cpu.001.pb.gz
将.pb.gz文件拷贝到mac本地,执行以下命令,在浏览器查看相关视图。
$ go tool pprof -http=:8081 pprof.yurt-tunnel-server.alloc_objects.alloc_space.inuse_objects.inuse_space.001.pb.gz
Serving web UI on http://localhost:8081
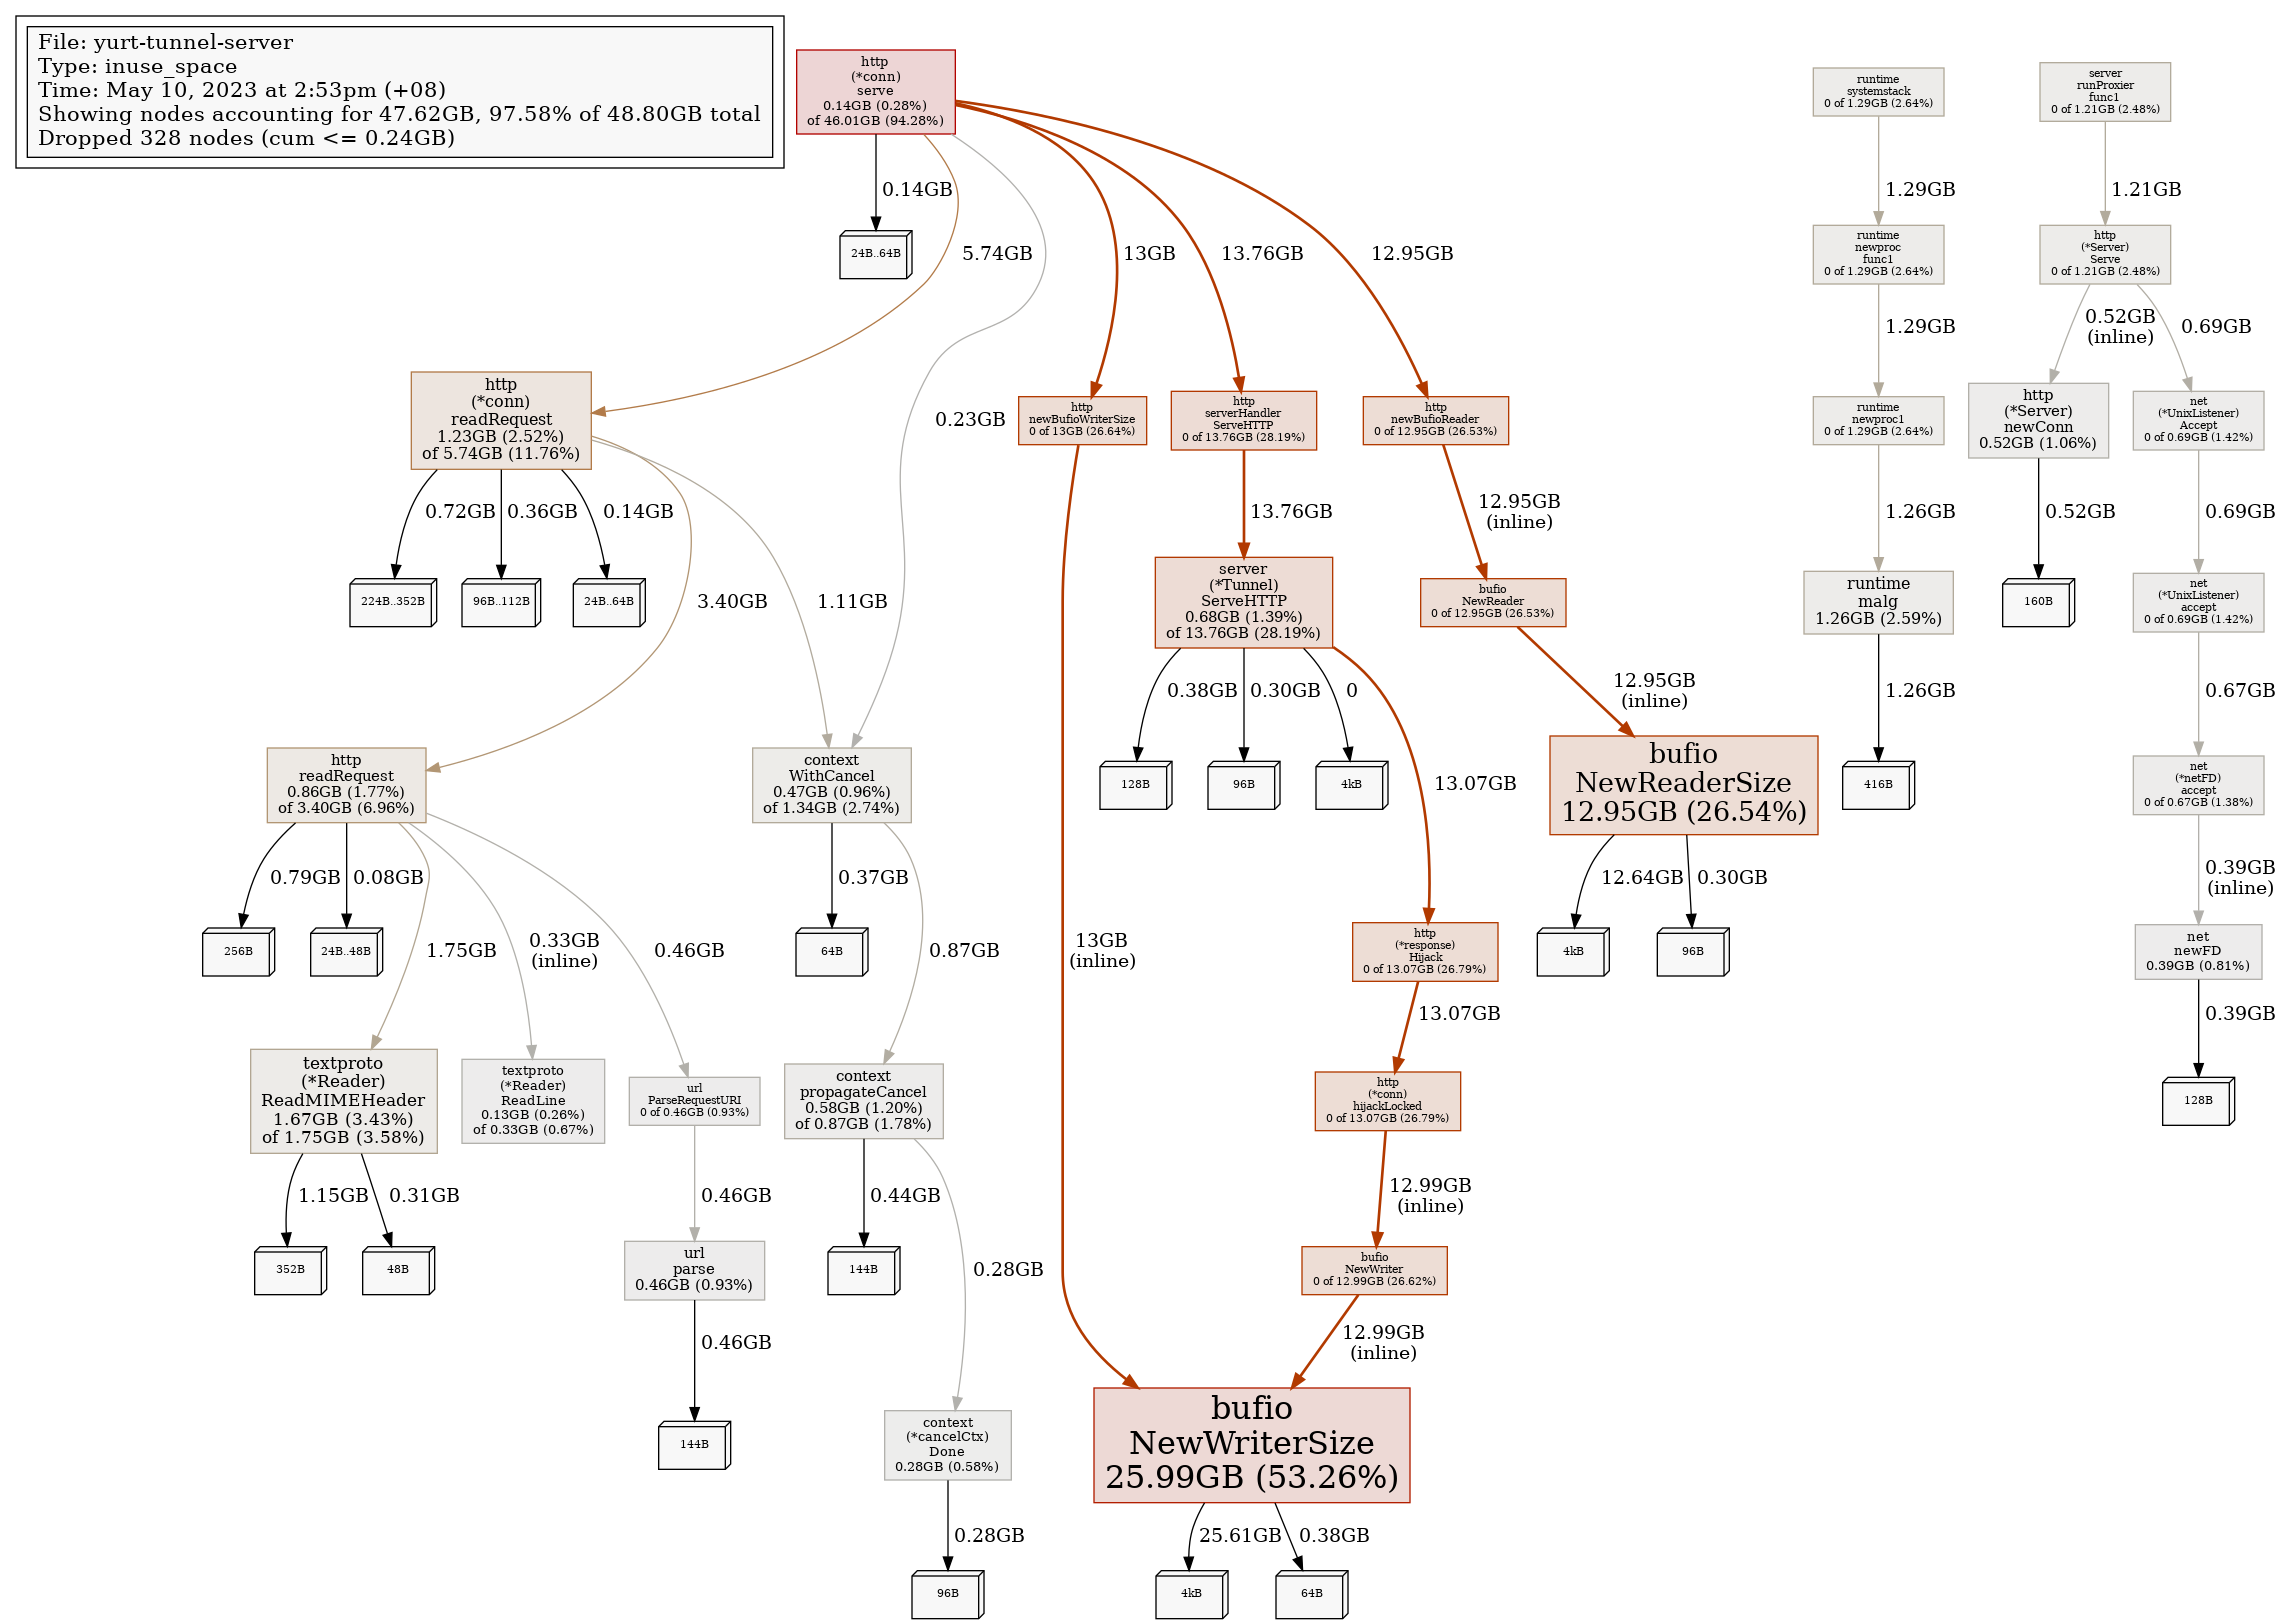
4.1. 内存分布图
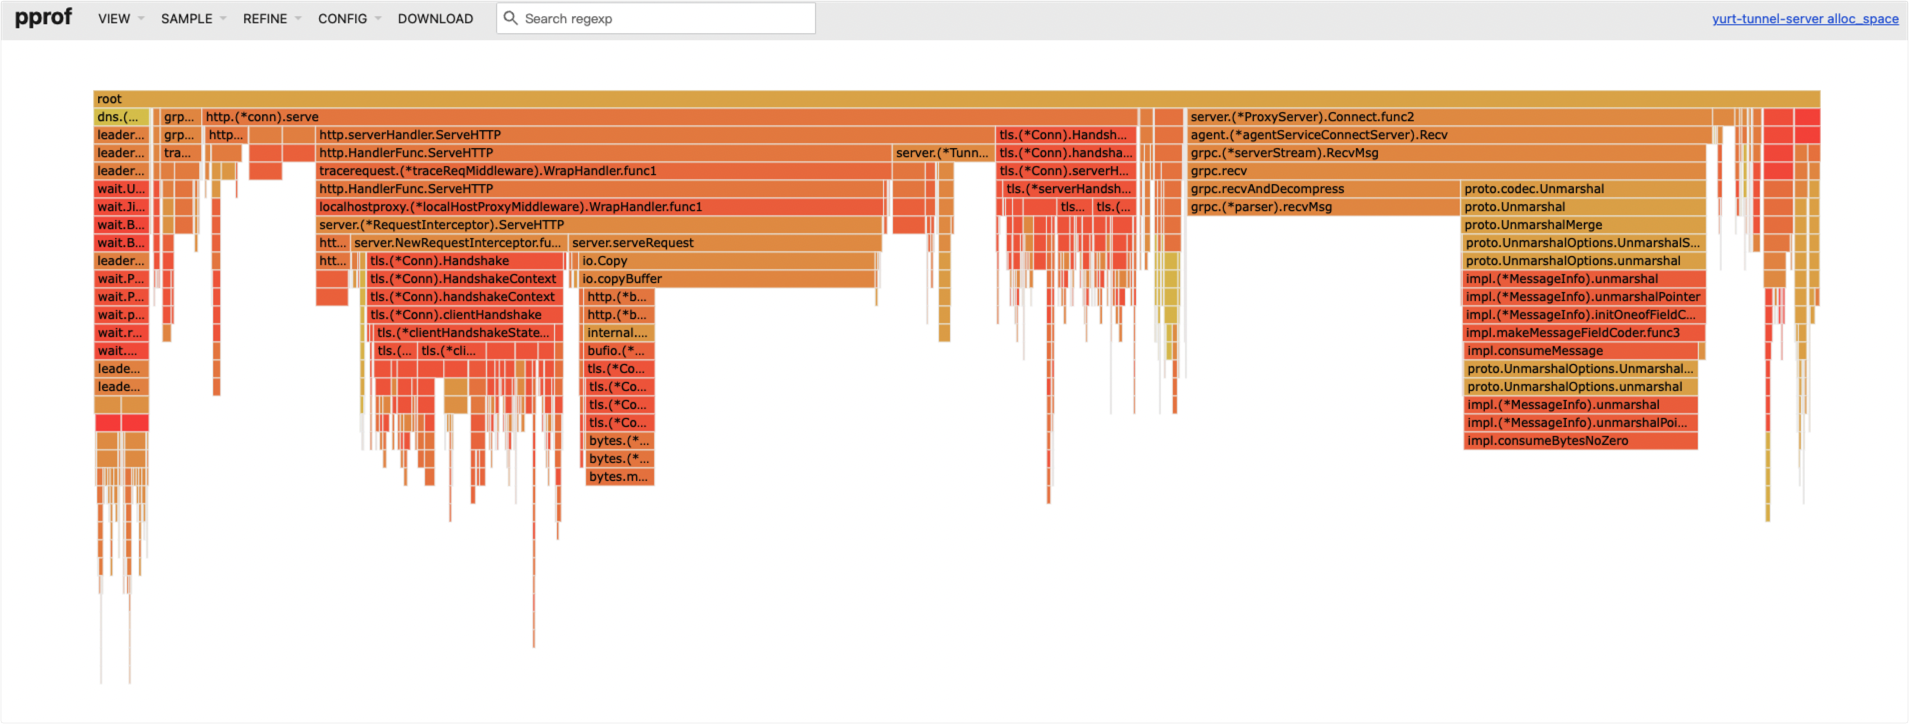
4.2. 火焰图
5. 查看goroutine泄露
可以通过访问web地址的/debug/pprof/goroutine路径,查看goroutine的详细分布情况。goroutine数量分布过多的地方可能会存在内存泄露的情况。
示例:
goroutine profile: total 3337450
3336630 @ 0x437fb6 0x40640c 0x405e38 0x1406b18 0x7c19bb 0x7bd528 0x4684c1
#    0x1406b17    sigs.k8s.io/apiserver-network-proxy/pkg/server.(*Tunnel).ServeHTTP+0xbb7    /go/pkg/mod/github.com/openyurtio/apiserver-network-proxy@v1.18.8/pkg/server/tunnel.go:105
#    0x7c19ba    net/http.serverHandler.ServeHTTP+0x43a                        /usr/local/go/src/net/http/server.go:2878
#    0x7bd527    net/http.(*conn).serve+0xb07                            /usr/local/go/src/net/http/server.go:1929

195 @ 0x437fb6 0x43095e 0x462d69 0x4c90b2 0x4ca41a 0x4ca408 0x525649 0x536665 0x7b7b8d 0x4fd5e6 0x140709a 0x7c19bb 0x7bd528 0x4684c1
#    0x462d68    internal/poll.runtime_pollWait+0x88                        /usr/local/go/src/runtime/netpoll.go:229
#    0x4c90b1    internal/poll.(*pollDesc).wait+0x31                        /usr/local/go/src/internal/poll/fd_poll_runtime.go:84
#    0x4ca419    internal/poll.(*pollDesc).waitRead+0x259                    /usr/local/go/src/internal/poll/fd_poll_runtime.go:89
#    0x4ca407    internal/poll.(*FD).Read+0x247                            /usr/local/go/src/internal/poll/fd_unix.go:167
#    0x525648    net.(*netFD).Read+0x28                                /usr/local/go/src/net/fd_posix.go:56
#    0x536664    net.(*conn).Read+0x44                                /usr/local/go/src/net/net.go:183
#    0x7b7b8c    net/http.(*connReader).Read+0x16c                        /usr/local/go/src/net/http/server.go:780
#    0x4fd5e5    bufio.(*Reader).Read+0x105                            /usr/local/go/src/bufio/bufio.go:213
#    0x1407099    sigs.k8s.io/apiserver-network-proxy/pkg/server.(*Tunnel).ServeHTTP+0x1139    /go/pkg/mod/github.com/openyurtio/apiserver-network-proxy@v1.18.8/pkg/server/tunnel.go:138
#    0x7c19ba    net/http.serverHandler.ServeHTTP+0x43a                        /usr/local/go/src/net/http/server.go:2878
#    0x7bd527    net/http.(*conn).serve+0xb07                            /usr/local/go/src/net/http/server.go:1929
上述goroutine的分布超过300万个,主要都分布在第一个部分,因此可以得出以下可能的结论:
/go/pkg/mod/github.com/openyurtio/apiserver-network-proxy@v1.18.8/pkg/server/tunnel.go:105 代码可能存在内存泄露的情况。
# 0x1406b17 sigs.k8s.io/apiserver-network-proxy/pkg/server.(*Tunnel).ServeHTTP+0xbb7 /go/pkg/mod/github.com/openyurtio/apiserver-network-proxy@v1.18.8/pkg/server/tunnel.go:105
因此我们追踪tunnel.go:105的源码:
    select {
#105    case <-connection.connected: // Waiting for response before we begin full communication.
    }
select 没有返回,导致goroutine不断累计。
5.1. 解决goroutine泄露
以上分析的代码来自apiserver-network-proxy。
我们可以查看该内存泄露的issue:
修复内存泄露的commit:
涉及代码修改如下:
	select {
	case <-connection.connected: // Waiting for response before we begin full communication.
	case <-closed: // Connection was closed before being established
	}
增加closed类型,退出goroutine。
参考:
Feedback
Was this page helpful?
Glad to hear it! Please tell us how we can improve.
Sorry to hear that. Please tell us how we can improve.